More actions

पूर्वावलोकन PNG का आकार SVG फ़ाइल: ६०० × ४८० पिक्सेल दूसरे रेसोल्यूशन्स: ३०० × २४० पिक्सेल | ९६० × ७६८ पिक्सेल | १,२८० × १,०२४ पिक्सेल | २,५६० × २,०४८ पिक्सेल।
मूल चित्र (SVG फ़ाइल, साधारणतः ६०० × ४८० पिक्सेल, फ़ाइल का आकार: १३ KB)
सारांश
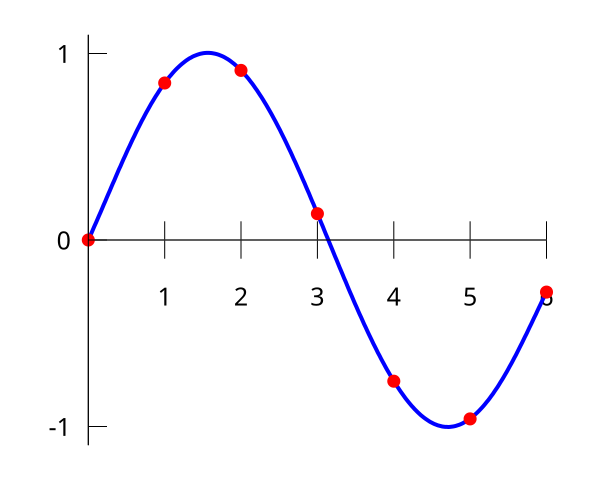
| विवरण | IIllustration of polynomial interpolation of a data set. The same data set is used for other interpolation algorithms in the Interpolation. |
| दिनांक | |
| स्रोत | self-made in Gnuplot |
| लेखक | Berland |
Based on png-version by User:Jitse Niesen (with gnuplot source code), and on svg-version by User:Cronholm144.
Gnuplot source code
set terminal svg fname "Vera" fsize 25
set output "Interpolation_example_polynomial.svg"
set key off
set xzeroaxis
set xtics axis 1,1
set ytics nomirror 1
set samples 300
set border 2
f(x) = - 0.0001521*x**6 - 0.003130*x**5 + 0.07321*x**4 - 0.3577*x**3 +  0.2255*x**2 + 0.9038*x
set yrange [-1.1:1.1]
plot f(x) with lines linetype 3 linewidth 4, \
     "-" with points linetype 1 pointtype 7 pointsize 0.7, \
       0 with lines linetype -1 linewidth 1
0 0
1 0.8415
2 0.9093
3 0.1411
4 -0.7568
5 -0.9589
6 -0.2794
e
Please use at least version 4.2 of Gnuplot for smooth lines in SVG.
लाइसेंस
| इस कार्य को इसके लेखक, Berland द्वारा सार्वजनिक डोमेन में प्रकाशित किया गया है। यह पूरे विश्व में लागू होता है। कुछ देशों में यह कानूनी तौर पर नहीं हो सकता है; ऐसा हो तो: Berland सभी को इस कार्य का इस्तेमाल किसी भी उद्देश्य से, बिना किसी बाधाओं के इन शर्तों के कानून द्वारा अनिवार्य किए तक करने की अनुमति देता/देती हैं। |
चित्र का इतिहास
चित्र पुराने समय में कैसी दिखती थी यह जानने के लिए दिनांक/समय पर क्लिक करें।
| दिनांक/समय | थंबनेल | आकार | सदस्य | टिप्पणी | |
|---|---|---|---|---|---|
| वर्तमान | ००:११, २७ जून २००७ | | ६०० × ४८० (१३ KB) | wikimediacommons>Berland | == Summary == {{Information |Description=IIllustration of polynomial interpolation of a data set. The same data set is used for other interpolation algorithms in the Interpolation. |Source=self-made i |
चित्र का उपयोग
यह पृष्ठ इस चित्र का इस्तेमाल करता है: