चित्र:Milankovitch Variations sv.png

मूल फ़ाइल (४७९ × ३६३ पिक्सेल, फ़ाइल का आकार: २५ KB, MIME प्रकार: image/png)


|
File:Milankovitch Variations-es.svg इस फ़ाइल का एक वेक्टर संस्करण है।. जब अवर न हो, इस PNG फ़ाइल की जगह इसका उपयोग किया जाना चाहिए।
File:Milankovitch Variations sv.png → File:Milankovitch Variations-es.svg
अधिक जानकारी के लिए Help:SVG देखें। |
 |
This is a Swedish translation of Milankovitch Variations.png [1].
![[1]](https://en.wikipedia.org/wiki/Image:Milankovitch_Variations.png)
Description at the english version:
सारांश
This figure shows the variations in Earth's orbit, the resulting changes in solar energy flux at high latitude, and the observed glacial cycles.
According to Milankovitch Theory, the precession of the equinoxes, variations in the tilt of the Earth's axis (obliquity) and changes in the eccentricity of the Earth's orbit are responsible for causing the observed 100 kyr cycle in ice ages by varying the amount of sunlight received by the Earth at different times and locations, particularly high northern latitude summer. These changes in the Earth's orbit are the predictable consequence of interactions between the Earth, its moon, and the other planets.
The orbital data shown is from Quinn et al. (1991). Principal frequencies for each of the three kinds of variations are labeled. The solar forcing curve (aka "insolation") is derived from July 1st sunlight at 65 °N latitude according to Jonathan Levine's insolation calculator [2] archive copy at the Wayback Machine. The glacial data is from Lisiecki and Raymo (2005) and gray bars indicate interglacial periods, defined here as deviations in the 5 kyr average of at least 0.8 standard deviations above the mean.
Copyright
This image was produced by Robert A. Rohde from publicly available data, and is incorporated into the Global Warming Art project.

|
इस दस्तावेज़ को Free Software Foundation द्वारा प्रकाशित GNU मुक्त प्रलेख लाइसेंस के संस्करण 1.2 या नए (बिना किसी अपरिवर्तनीय अनुभागों और अगले या पिछले आवरण के टेक्स्ट के) के अंतर्गत प्रतिलिपि बनाने, बाँटने और/या बदलने की अनुमति प्रदान की जाती है। इस लाइसेंस की एक प्रतिलिपि GNU मुक्त प्रलेख लाइसेंस नामक अनुभाग में शामिल है।http://www.gnu.org/copyleft/fdl.htmlGFDLGNU Free Documentation Licensetruetrue |
  
|
इस फ़ाइल को क्रिएटिव कॉमन्स श्रेय-समानसांझा 3.0 अनांतरित लाइसेंस के अंतर्गत लाइसेंस किया गया है। | |
| ||
| This licensing tag was added to this file as part of the GFDL licensing update.http://creativecommons.org/licenses/by-sa/3.0/CC BY-SA 3.0Creative Commons Attribution-Share Alike 3.0truetrue |
References
- Lisiecki, L. E., and M. E. Raymo (2005), A Pliocene-Pleistocene stack of 57 globally distributed benthic d18O records, Paleoceanography 20, PA1003, doi:10.1029/2004PA001071.[3][मृत कड़ी]
- Quinn, T.R. et al. "A Three Million Year Integration of the Earth's Orbit." The Astronomical Journal 101 pp. 2287-2305 (June 1991).
Captions
फ़ाइल का इतिहास
फ़ाइल पुराने समय में कैसी दिखती थी यह जानने के लिए दिनांक/समय पर क्लिक करें।
| दिनांक/समय | अंगूठाकार | आकार | सदस्य | टिप्पणी | |
|---|---|---|---|---|---|
| वर्तमान | २२:५९, १४ दिसम्बर २००६ | 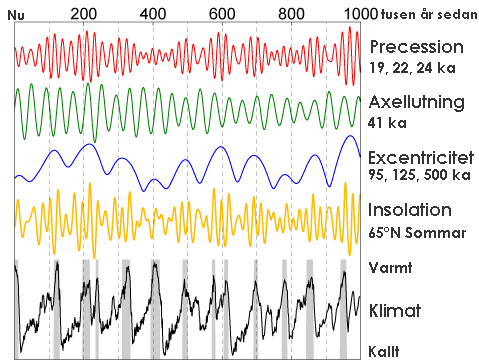 | ४७९ × ३६३ (२५ KB) | smartcommons>Shinzon | This is a Swedish translation of Milankovitch Variations.png [http://en.wikipedia.org/wiki/Image:Milankovitch_Variations.png]. Discription at the english version: == Description == This figure shows the variations in Earth's orbit, the resulting chan |
चित्र का उपयोग
कोई भी ऐसा पृष्ठ नहीं है जो इस चित्र का प्रयोग कर रहा हो।
