चित्र:Naa newspaper ad revenue.svg

इस SVG फ़ाइल के PNG पूर्वावलोकन का आकार: २२० × १४४ पिक्सेल। दूसरा रेसोल्यूशन: ३२० × २१० पिक्सेल।
मूल फ़ाइल (SVG फ़ाइल, साधारणतः ५११ × ३३५ पिक्सेल, फ़ाइल का आकार: ७१ KB)
सारांश
| विवरणNaa newspaper ad revenue.svg |
English: US newspaper advertising revenue, corrected for inflation |
| दिनांक | |
| स्रोत |
अपना कार्य |
| लेखक | Dave Farrance |
| SVG genesis InfoField | |
| मूल कोड InfoField | Python code#!/usr/bin/env python3
from matplotlib.pylab import *
print1950=[2070,2251,2464,2632,2685,3077,3223,3268,3176,3526,3681,3601,3659,
3780,4120,4426,4865,4910,5232,5714,5704,6167,6939,7481,7842,8234,9618,
10751,12213,13863,14794,16527,17694,20581,23522,25170,26990,29412,31197,
32368,32280,30349,30639,31869,34109,36092,38075,41330,43925,46289,48670,
44305,44102,44939,46703,47408,46611,42209,34740,24821,22795,20692,18931,
17300, 16400, 14870]
onlin2003=[1216,1541,2027,2664,3166,3109,2743,3042,3249,3340,3420,3500]
infla1950=[1.3,7.9,1.9,0.8,0.7,-0.4,1.5,3.3,2.8,0.7,1.7,1.0,1.0,1.3,
1.3,1.6,2.9,3.1,4.2,5.5,5.7,4.4,3.2,6.2,11.0,9.1,5.8,6.5,7.6,11.3,13.5,
10.3,6.2,3.2,4.3,3.6,1.9,3.6,4.1,4.8,5.4,4.2,3.0,3.0,2.6,2.8,3.0,2.3,1.6,
2.2,3.4,2.8,1.6,2.3,2.7,3.4,3.2,2.8,3.8,-0.4,1.6,3.2,2.1,1.5,1.6,0.1]
corr1950= array( [0.001]*len(infla1950) )
for j in range(len(corr1950) - 2, -1, -1):
corr1950[j] = corr1950[j+1] * ((100.0 + infla1950[j+1]) / 100.0)
rc('axes', lw=2.0)
plot(range(1950, 1950 + len(print1950)), print1950 * corr1950,
'r-', lw=4.0, label='Print revenue')
plot(range(2003, 2003 + len(onlin2003)),
onlin2003 * corr1950[2003 - 1950: 2003 - 1950 + len(onlin2003)],
'b-', lw=4.0, label='Online revenue')
xticks(size=14.5)
yticks(size=14.5,va='baseline')
grid(lw=0.75)
ylabel("Billions of today\'s dollars", size=14.5)
rc('legend', fontsize=14.5, edgecolor="black"); legend(loc=2)
savefig('naa_newspaper_ad_revenue.svg')
show()
|


लाइसेंस
With the proviso that some rights to the numerical source data may be retained by the Newspaper Association of America, I release the graph and its source program to the public domain.
मैं, इस कार्य का/की कॉपीराइट धारक, इसे निम्न लाइसेंस के अंतर्गत प्रकाशित करता/करती हूँ:
 
|
इस फ़ाइल को क्रिएटिव कॉमन्स CC0 1.0 वैश्विक सार्वजनिक डोमेन समर्पण के अंतर्गत उपलब्ध कराया गया है। |
| कार्य को इस आलेख से संबद्ध करने वाले व्यक्ति ने पूरे विश्व में कॉपीराइट कानूनों के अंतर्गत कार्य पर कानून की अनुमोदित सीमा तक सभी संबंधित अधिकारों समेत अपने सभी अधिकार त्यागकर इसे सार्वजनिक डोमेन को समर्पित किया है। आप बिना अनुमति के कार्य की प्रतियाँ बना सकते हैं, इसे बदल और पुनः वितरित कर सकते हैं, और प्रदर्शित कर सकते हैं, वाणिज्यिक उद्देश्यों से भी।
http://creativecommons.org/publicdomain/zero/1.0/deed.enCC0Creative Commons Zero, Public Domain Dedicationfalsefalse |
Captions
Add a one-line explanation of what this file represents
फ़ाइल का इतिहास
फ़ाइल पुराने समय में कैसी दिखती थी यह जानने के लिए दिनांक/समय पर क्लिक करें।
| दिनांक/समय | अंगूठाकार | आकार | सदस्य | टिप्पणी | |
|---|---|---|---|---|---|
| वर्तमान | ००:०७, २८ अगस्त २०१८ | 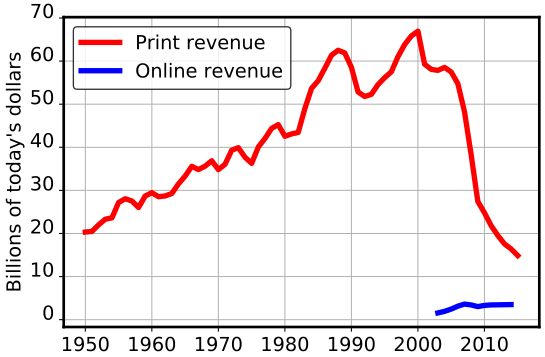 | ५११ × ३३५ (७१ KB) | smartcommons>Farry | Correction to inflation calculation |
चित्र का उपयोग
कोई भी ऐसा पृष्ठ नहीं है जो इस चित्र का प्रयोग कर रहा हो।
